-
Technical
Find technical information on refrigeration, air conditioning and heat pumps
P-h Chart for fault diagnosis part 2 (F4)
Non-member price: Not available
Member price: Free
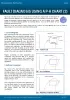
P-h Chart for fault diagnosis part 2 (F4)
This second in the series of how P-h charts can be put to everyday use to diagnose faults and help improve the efficiency of installed refrigeration and air conditioning systems looks at loss of refrigerant and compressor efficiency.
Reading and interpreting a pressure-enthalpy chart (also referred to as P-h chart or diagram and as a Mollier diagram) is a key skill for diagnosing problems and maximising efficiency. It is a key element behind the F gas training that started earlier this year.
Efficiency is not just about saving the customer running costs—if a system is not working efficiently then it may not achieve its required output, it will use more power and is likely to fail prematurely.
Members - sign in to your web account to download this free pdf.
Not a member? Subscribe to our Technician mailings to download this and other publications.
Non members - either click on the basket to purchase this item (prices include VAT) or find out how you can become a member and receive this and other publications and updates free.
Log in to your account (top right) to download this free guide.
Find out more
Technical information on refrigeration, air conditioning and heat pumps:
- Looking for previously purchased publications?
- Search publications 1899-2013 in our archives
- Request to reuse our ISBN/ISSN content
Sitemap